Doctor of Dental Surgery
Class of 2028Admissions Statistics
Applications
2086 completed & reviewed
80 students enrolled
2 MHA Pathway candidates
2 BS/DDS candidates
Geography
In-State 55% / Out of State 45%
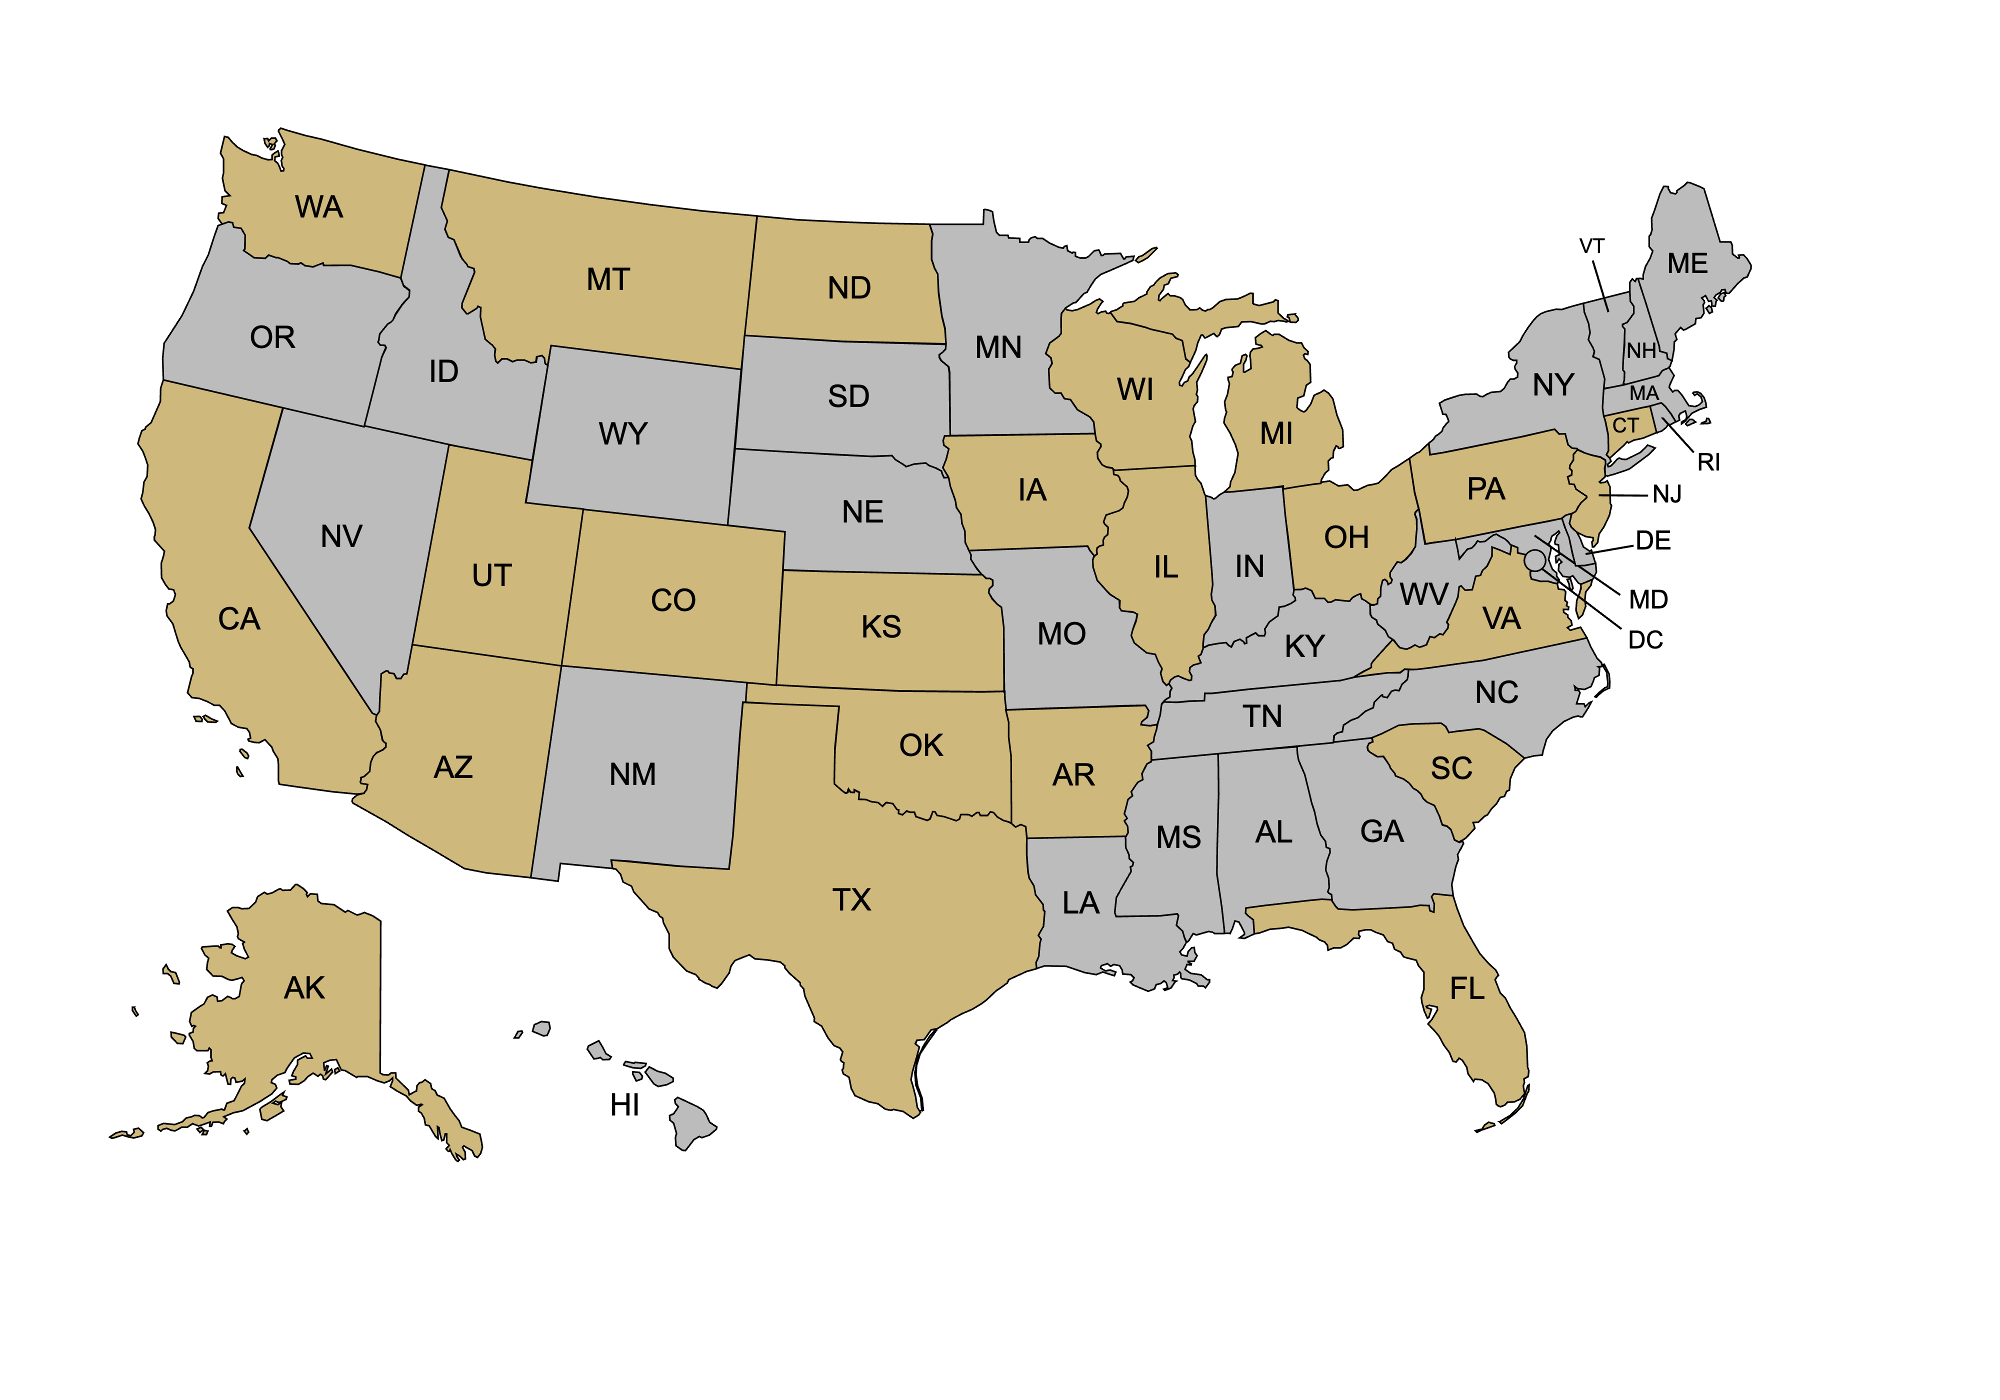
23 States Represented
One Country Represented: Ethiopia
Urban areas 9%
Rural areas 26%
Military 3%
Identify As
Male 42.5% / Female 57.5%
First-Generation 27.5%
More Stats
Avg. Age 24
Cum. GPA 3.6
Sci. GPA 3.55
Avg. DAT 20

23 U.S. states are represented in the DDS Class of 2028, shown in gold.